|
Ocean Dynamics in Matlab A Numerical Laboratory of Ocean Dynamics |
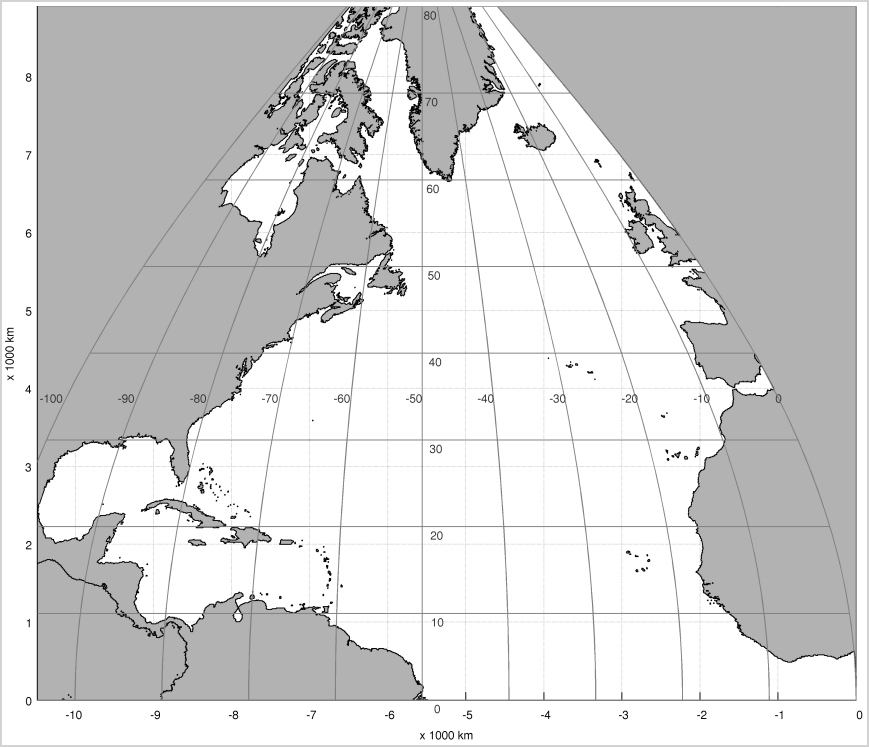
Odylab / Tsunamis / North Atlantic
Real-time Simulations of Tsunami Arrivals
Instructions
- On the map, click some points to create a polygon defining the tsunami source region. Hold down the Ctrl key when you click the last point to close the polygon. You may create a polygon anywhere in the ocean. You may also create a special polygon, a 100km x 100km square centered at a point, by just one click and the hold-down of the Ctrl key at the same time. If you do not like what have been clicked, you can press the "Clear" button on the top of the map, and re-start the clicking.
- In the check boxes, check a single or several points of interest. Then, press the "Make plot" button.
- In a few seconds, you will see the tsunami arrival curve(s) at the point(s) of interest in a pop-up window. If no pop-up window appears, you may need to tell your browser to allow pop-up windows from this site.
Notes
- The source tsunami is set up as one unit evenly distributed in the chosen polygon. You may choose 1 meter, 1 foot, 10 meters, or whatever as your source unit. The arrival curves are measured in the same unit as the source unit.
- The model resolution is 5 minutes in longitude and latitude. This means that the source polygon can be as fine as about 10km square at the equator and finer at higher latitudes.
- More points of interest will be added later, including some of the existing CHS tidal gauges, and some points in the estuary and Gulf of St. Lawrence.
- If you have any problems or comments, please send them to Zhigang Xu at xuz@dfo-mpo.gc.ca.
Real-time Tsunami Simulation
| (Lon,Lat): | (,) | (X,Y): | (,) |